In this article, SQL Group BY Clause Simplified, we’ll walk you through how to use the GROUP BY statement using Adventure Works data, a sample database provided by Microsoft.
SQL is a very intuitive and powerful language for relational databases, it is a very powerful language for cleaning, transforming, and finding insight from data. It is similar to Pandas in Python.
Click here to learn more on how to transform data using Pandas.
Before we get started, let’s take a quick look at what the GROUP BY statement does.
Simply put, the GROUP BY statement groups rows in a table based on a specified column or set of columns.
Once the rows are grouped, aggregate functions such as SUM(), COUNT(), AVG(), MAX(), or MIN() can be applied to each group to produce summary statistics.
We’ll be using a few tables from Adventure Works database to demonstrate how GROUP BY works in practice.
First, let’s take a look at the SalesOrderHeader table.
This table contains information about each sale made by the company, including the sales order ID, order date, and total due for each order.
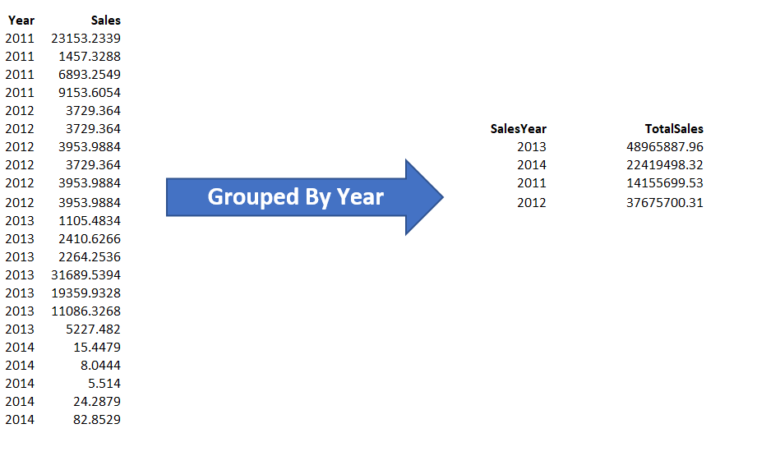
We can use the GROUP BY statement to group the sales by year, and then calculate the total sales for each year:
SELECT YEAR(OrderDate) AS SalesYear, SUM(TotalDue) AS TotalSales
FROM Sales.SalesOrderHeader
GROUP BY YEAR(OrderDate);
In this example, we’re selecting the year from the OrderDate column using the YEAR() function, and then calculating the sum of the TotalDue column for each group.
The GROUP BY statement groups the sales by year, and the result set looks something like this:
SalesYear TotalSales
2013 48965887.9632
2014 22419498.3157
2011 14155699.525
2012 37675700.312
As you can see, the data has been grouped by year and the total sales for each year have been calculated.
Let’s try another example using the SalesPerson and SaleTerritory tables. This tables contains information about each salesperson in the company, including their name, territory, and sales quota.
We can use the GROUP BY statement to group the salespeople by territory, and then calculate the average sales quota for each territory:
SELECT t.Name as Territory, AVG(s.SalesQuota) AS AvgSalesQuota
FROM Sales.SalesPerson s
join
Sales.SalesTerritory t on s.TerritoryID = t.TerritoryID
GROUP BY t.Name;
In this example, we’re selecting the Name column from SalesTerritory table and calculating the average SalesQuota from SalesPerson table for each group.
The GROUP BY statement groups the salespeople by territory, and the result set looks something like this:
Territory AvgSalesQuota
Australia 250000.00
Canada 250000.00
Central 250000.00
France 250000.00
Germany 250000.00
Northeast 300000.00
Northwest 266666.6666
Southeast 300000.00
Southwest 250000.00
United Kingdom 250000.00
As you can see, the data has been grouped by territory and the average sales quota for each territory has been calculated.
GROUP BY clause has three other functions that can be used to enhance the analysis of data. These are: ROLLUP, CUBE, and GROUPING SETS.
ROLLUP:
The ROLLUP function is used to perform subtotals on a set of columns. It creates a hierarchy of grouping sets, where each subsequent grouping set is a superset of the previous set.
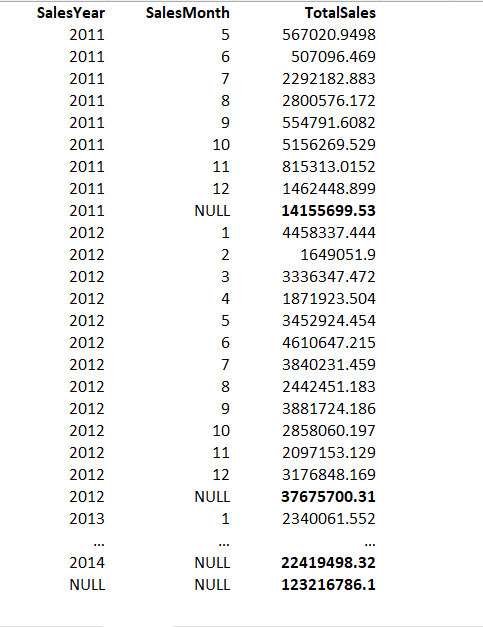
This means that ROLLUP can be used to calculate subtotals for each combination of columns in a table. Here’s an example using the SalesOrderHeader table from the Adventure Works database:
SELECT YEAR(OrderDate) AS SalesYear, MONTH(OrderDate) AS SalesMonth, SUM(TotalDue) AS TotalSales
FROM Sales.SalesOrderHeader
GROUP BY ROLLUP(YEAR(OrderDate), MONTH(OrderDate));
In this example, we’re using the ROLLUP function to calculate subtotals for each year and month combination and a grand total for all sales. The result set looks something like this:
CUBE:
The CUBE function is similar to ROLLUP, but it generates all possible combinations of grouping sets, instead of just a hierarchy.
This means that CUBE can be used to calculate subtotals for each combination of columns in a table.
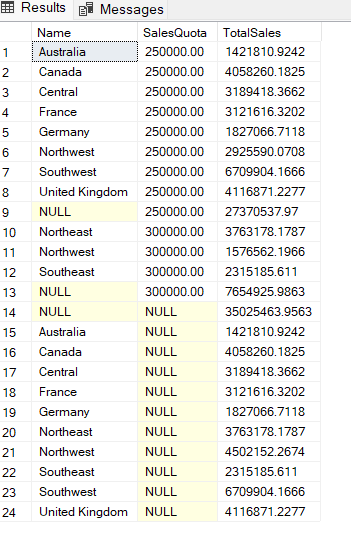
Here’s an example using the SalesPerson and SalesTerritory tables from the Adventure Works database:
SELECT t.Name, s.SalesQuota, SUM(s.SalesYTD) AS TotalSales
FROM Sales.SalesPerson s
join
Sales.SalesTerritory t on s.TerritoryID = t.TerritoryID
GROUP BY CUBE(t.Name, s.SalesQuota);
In this example, we’re using the CUBE function to calculate subtotals for each combination of territory and sales quota. The result set looks something like this:
Conclusion
In this article: SQL Group By clause simplified, you have learnt that GROUP BY statement in SQL allows us to group data by one or more columns in a table and perform aggregate functions on the data.
The ROLLUP, CUBE, and GROUPING SETS functions are extensions of the GROUP BY statement that allow us to perform multi-dimensional analysis of data by creating subtotals and all possible combinations of grouping sets.
By using these functions, we can gain insights into our data that might not be immediately apparent with simple GROUP BY statements.
For example, we can easily calculate subtotals for each year and month combination, as well as subtotals for each year and a grand total for all sales.
It’s important to note that these functions can be computationally expensive, especially with large datasets, so it’s important to use them judiciously and with appropriate indexing.
To learn more about GROUP BY, ROLLUP, CUBE, and GROUPING SETS, and how to use them effectively in SQL, here are some helpful resources:
- Microsoft Docs: GROUP BY clause (Transact-SQL)
- Microsoft Docs: ROLLUP
- Microsoft Docs: CUBE
- Microsoft Docs: GROUPING SETS
Regenerate response