Over time, businesses want to understand their customers, check the performance of their customer success team and find out what a group of customers’ user experience is like through the products’ sales funnels. In this article we will discuss customer cohort analysis using Tableau and Fixed Level of Detail expression. Below are the heading that will form building blocks of this article.
- Overview of Cohort Analysis
- Definition of Cohort Analysis
- Three Main Areas In Customer Cohort Analysis
- Simple Cohort Analysis in Tableau
- Conclusion
Overview of Cohort Analysis
For instance, a business that wants to understand their customers acquisition and retention could group them by year of acquisition.


If you made your first purchase in 2017, you belong to the 2017 group or cohort, same way if you made your first purchase in 2019, you belong to the 2019 group or cohort. Your first purchase determines the cohort you belong to.
Definition of Cohort Analysis
Cohort analysis is a type of behavioral analytics in which you group your users based on their shared behaviour to better track and understand their actions.
Cohort analysis allows you to ask more granular questions and make informed product decisions that will reduce churn, increase retention and inturn increase revenue.
Three Main Areas In Customer Cohort Analysis
Cohort analysis allows you to see three main things in your customers.
- How is the loyalty of your customers? How are they returning to your business for more purchase? This shows how they are doing in terms of customer retention. This helps the customer success team understand how they are performing.
- How good you are in acquiring new customers and the value of the new customers. In essence cohort analysis can be used to know the count of new customers and the revenue generated from the new customers.
It helps answer the question like why is the customer acquisition rate going down, does that mean we have reached some saturation points, does it mean a competitor is acquiring new customers better than us, is it because of the size of the business or maybe we are not doing good at our end.
- Track how the cohorts go through the user experience or product funnel. Some of the funnels the track are (a) Registered but didn’t log in, (b) Logged in © Had one conversation (d) Had five conversation (e) Paid
Simple Cohort Analysis in Tableau
To do a cohort analysis of your customers, at the basic level you need columns such as the customer unique identifier, revenue and order date.
Depending on what you want to plot over time, if you want to do a cohort of analysis on the customer acquisition, you will need to get distinct customer counts. If you want to do a cohort analysis of the value of the customers acquired, you will need the revenue column.
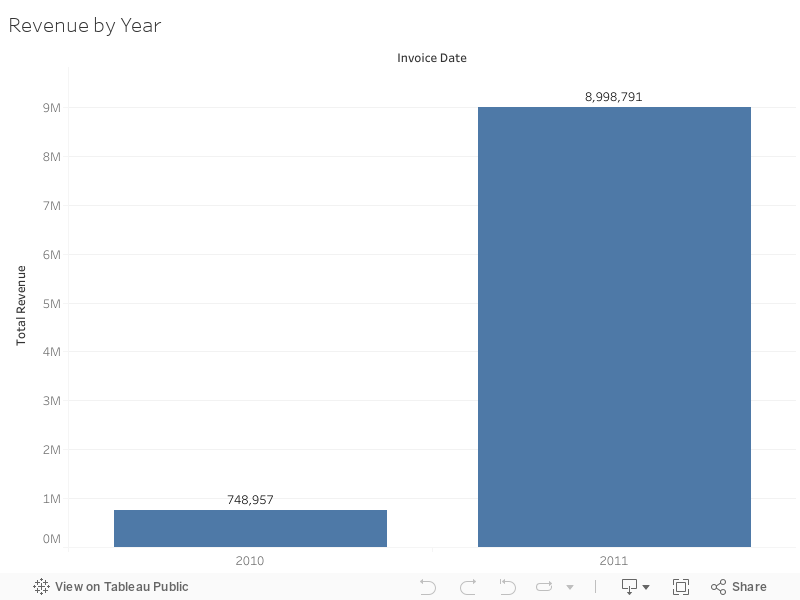
So, say we want to start with the value of the customers acquired over the two years of transactions as shown in our dataset, in the chart below. 2011 recorded 10 times the revenue generated from these customers in 2010.
Now, to get the year of the first purchase, we need to create a calculated field using a Fixed Level of Details expression. You can check my well detailed article on Level Of Detail expression here.

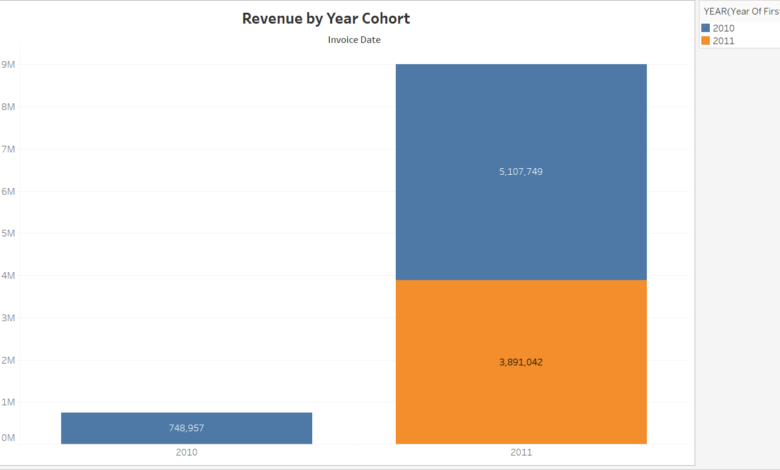
The above expression checks for the minimum date (earliest date) the customer made a transaction. This will be the customer’s year of first purchase. When we added the Year of First Purchase calculated field to the color, Tableau automatically changes the chart to a stacked bar chart with blue and orange colours.
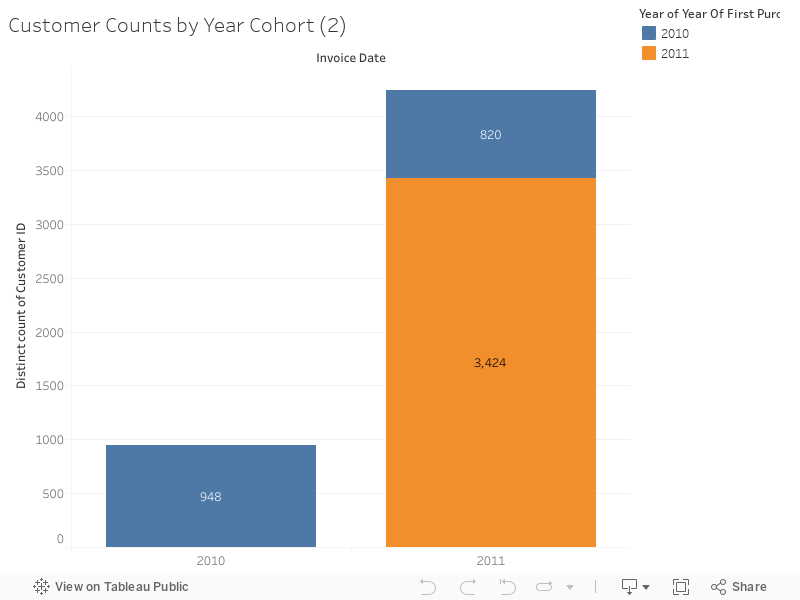

The blue colour represents the 2010 cohort. That is customers that made their first purchase in 2010 while the orange bar represents the customers that made their first purchase in 2011, that is the 2011 cohort.
From the visual, it is clear that the customer success acquisition team have done a great job in acquiring new customers; however, they lost over a 100 customers from the 2010 cohort. The business acquired over 2000 new customers in 2011 cohort but had over a 100 churned from 2010 cohort.
This apparently is a success, but remember that it is a widely known fact that it costs more to acquire customers than it costs to retain them. It is a rule of thumb that businesses will make efforts to retain their customers. Repeat customers are the true customers. Hence the customer success team will need to do more to ensure that the customers are retained.
Another important fact to look into in this analysis is the quality of the customer cohort. A careful observation and comparison of the number of customers acquired and the value of the customers in the two different cohort shows that 2010 cohort brought more revenue in 2011 more that the 2011 cohort did.
In essence, 820 customers from 2010 cohort brought in a revenue of over 5million while 3424 customers from 2011 cohort brought in a revenue of a little below 4milion. This further explains the importance of retaining your customers.
Conclusion
The importance of cohort analysis cannot be overemphasized. Our analysis above shows that although the retained customers are fewer than the newly acquired customers, they brought in more value to the business in 2011.
Reference
https://www.kaggle.com/datasets/ersany/online-retail-dataset
Cohort Analysis | Tableau Public